import numpy as np
import matplotlib.pyplot as plt
r = np.arange(0, 2, 0.01)
theta = 2 * np.pi * r
fig, ax = plt.subplots(
subplot_kw = {'projection': 'polar'}
)
ax.plot(theta, r)
ax.set_rticks([0.5, 1, 1.5, 2])
ax.grid(True)
plt.show()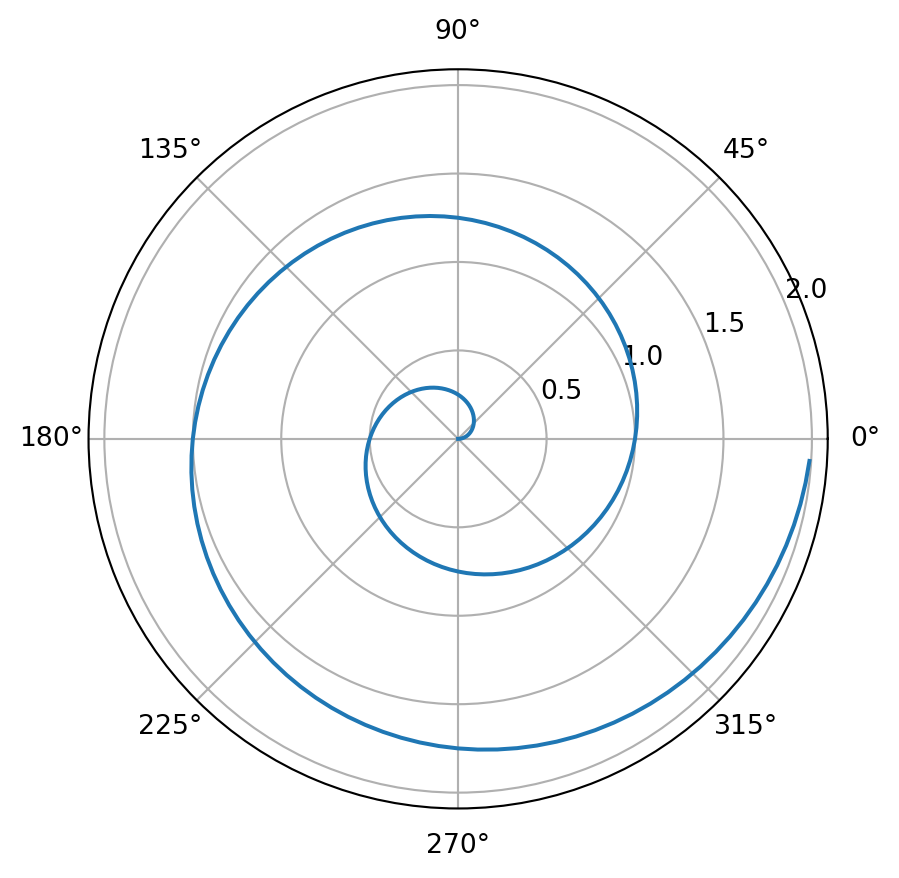
Se ha configurado el diseño del html combiando un fichero yaml e incluyendo código yaml en el notebook.
El yaml en la cabecera del código contiene:
project:
  type: website
  output-dir: docs

format:
  html:
    theme: style.css
El cuál no reacciona a la indicación de output-dir y genera el fichero html en el mismo directorio en el que se ejecuta el notebook.
For a demonstration of a line plot on a polar axis, see Figura 1.
import numpy as np
import matplotlib.pyplot as plt

r = np.arange(0, 2, 0.01)
theta = 2 * np.pi * r
fig, ax = plt.subplots(
  subplot_kw = {'projection': 'polar'}
)
ax.plot(theta, r)
ax.set_rticks([0.5, 1, 1.5, 2])
ax.grid(True)
plt.show()